Dashboard & Export
The dashboard
The dashboard (/dashboard) is the landing page and adapts to the viewer's organization type:
- Issuer (Central bank) — supply KPIs, a mint/burn summary, action buttons (Mint / Burn / Send), a personal "pending on you" banner, and the activity log.
- Participant (Commercial bank) — a total-balance hero aggregated across the org's accounts, top wallets, exchange-state alerts (frozen/unlinked), action buttons (Send / Convert), the personal banner, and the activity log.
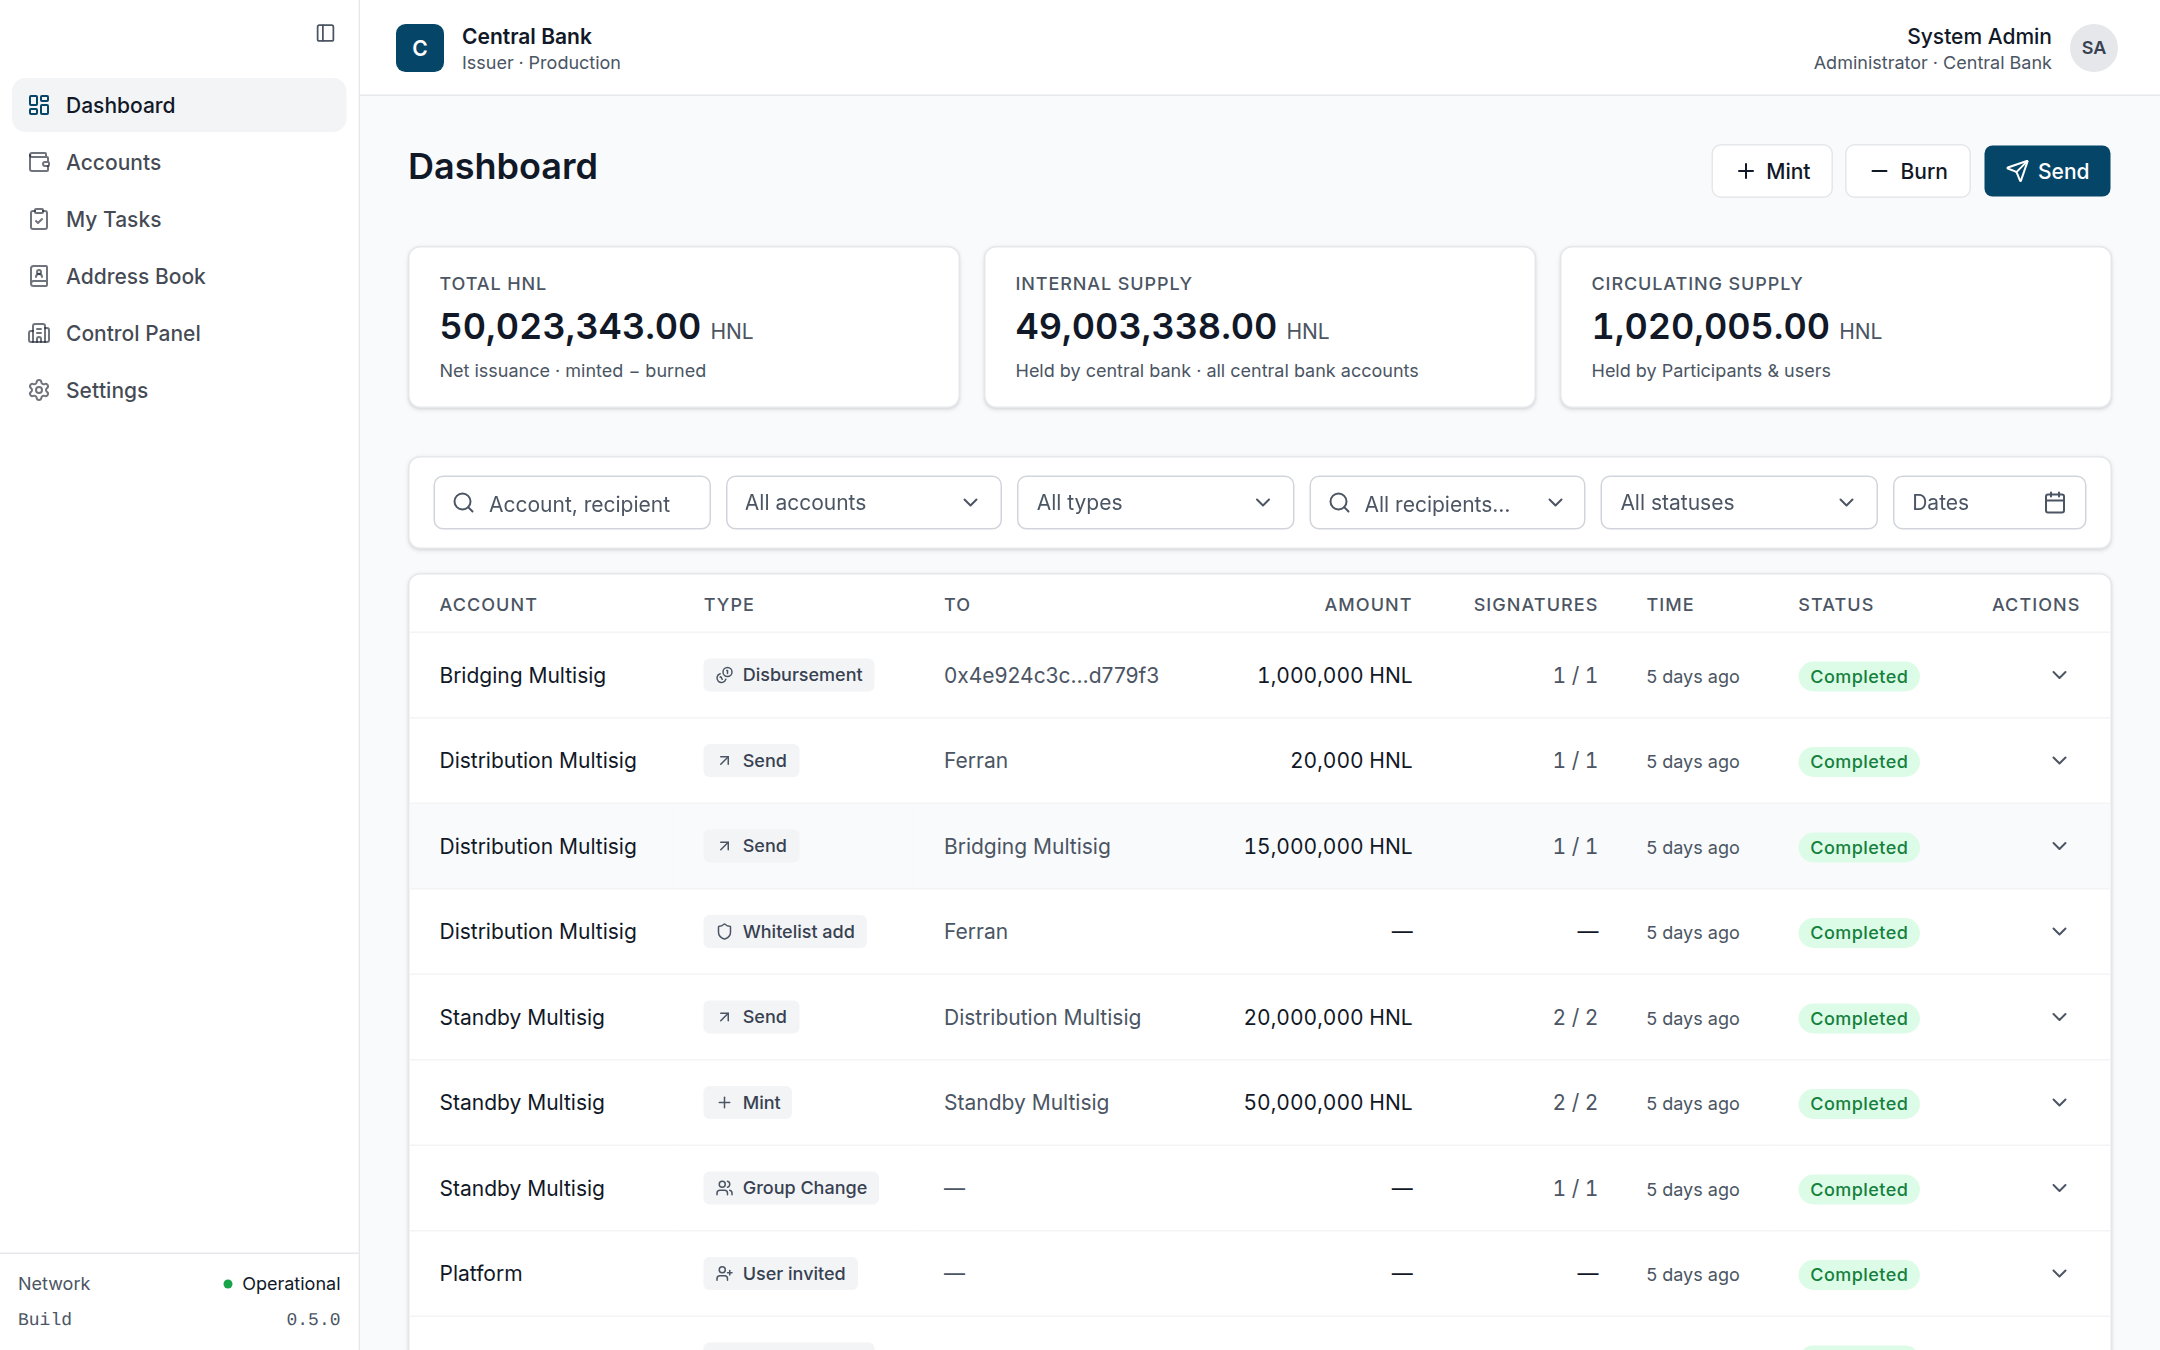 Issuer dashboard: Total CBDC, Internal supply and Circulating supply KPIs above the org-wide activity log, with Mint / Burn / Send in the header.
Metrics
GET /api/dashboard/metrics returns, per organization, the live numbers the chain is the source of truth for:
| Field | Meaning |
|---|---|
tokens[].liveSupply | Total on-chain supply of each token (per denom, with symbol/exponent) |
wallets[] | Each account's live balances (multisigId, name, type, balances) |
externalCirculating | Live supply minus the sum of all internal account balances (floored at 0) — i.e. tokens that have left the institution |
All values are queried from the chain on demand; the dashboard refreshes them on TanStack Query's polling interval.
Export
GET /api/export/transactions and GET /api/export/governance stream a downloadable file. Query parameters:
format—csv(default) orjsonmultisigId— restrict to one accountfrom/to— date range
The response sets Content-Disposition: attachment with the matching Content-Type (text/csv or application/json). Visibility follows the role/permission model: administrators and auditors see everything; members see only the accounts they belong to.